
Census Response Rate
National self-response rate:
67%
New York City self-response rate:
61.8%
https://2020census.gov/en/response-rates.html
Check out your own community:
New York local self-response maps from the Center for Urban Research at the CUNY Graduate Center
U.S. Census Bureau releases estimate of the U.S. population as of April 1, 2020 of 332.6 million
U.S. Census Bureau releases estimates of Population and Housing Units as of July 1, 2020

Dates to Know
September 30, 2021: Redistricting data will be released to all states.
Census Reports: U.S. Population Increases in 2023, but New York State Sees Population Decline
In 2023, the population in the United States grew by 0.5% to 334,914,895 total people. The US gained 1.6 million people since 2022.
While the overall population of the United States increased, New York had the largest population decline seeing 101,984 people leaving the State between July 2022 and July 2023 (0.52% decline). California had the second largest population decline, losing 75,423 people. Even though New York lost the most people in 2023, its overall population stands at 19,571,216 which makes New York the fourth most populous state in the country (only Florida, Texas, and California have a higher population).
Despite New York being the fourth most populous state, our three-year population decline can have negative effects on the State’s economy. Our budget relies on personal income tax, so less taxpayers equates to a smaller revenue base for the State budget. In addition, New York State lost a seat in the House of Representatives in 2022 due to the population decline. Because of these negative effects, New York State officials are working to find ways to increase our population like building more affordable housing.
If you want to learn more about the population trends in the United States and New York State, visit:
U.S. Population Trends Return to Pre-Pandemic Norms as More States Gain Population; New York Continues to Lead Nation in Population Loss
2020 Census Key Updates: Black Population
Demographic changes in our country as well as improvements to the ways in which race and ethnicity data are collected and evaluated have revealed that the U.S. population is more racially and ethnically diverse than measured in 2010.
The 2020 census included a “detailed response” option with the race prompt within the questionnaire. This detailed response included two options: “race alone” and “race alone or in any combination.” A “race alone” example response would be reporting one is just Zimbabwean and “race alone or in any combination” example response would be reporting one is Zimbabwean and St. Lucian.
The Census Bureau continues to release important data from the recent census
Highlights
Black Population Census 2020 Facts:
- African American was the most reported detailed response by those who identified their race as Black or African American in the 2020 census.
- 46,936,733 respondents identified as Black or African American alone or in combination
- Over 50 percent of Black respondents reported being African American
- The Sub-Saharan African and Caribbean Regional groups combined made up over 10% of the Black population.
- The largest Sub-Saharan African groups were Nigerian, Ethiopian, Somali and Ghanaian
- Jamaican, Haitian, Trinidadian and Tobagonian, and West Indian made up the majority of Caribbean populations; about 90%.
- Jamaican and Haitian comprised 80.5% of the Caribbean alone population
- Texas, Georgia, and Florida have the nation’s largest African American populations
- New York State Statistics:
- 20% of the Sub-Saharan population lived in Texas and New York
- 60% of Caribbean groups lived in Florida and New York
- Haitian was the largest Black Population group in five counties including Rockland County, New York
- Bronx County, New York had the largest Ghanaian Population in the nation (15,631)
- Kings County/Brooklyn, New York had the largest Trinidadian and Tobagonian population in the nation (32,613)
- Additional Highlights from 2020 Census:
- 90.3% of African Americans ages 25 or older hold a high school diploma or higher
- 33.7% of the Black population ages 16 and older work in management, business, science, and arts occupations
- 140,918 Black-owned employer businesses in the U.S. in 2020
- 2 million Black Civilian military veterans nationwide
- Poverty Rate for the U.S. Black population fell to a historic low of 17.1% in 2022
- Poverty rates for Black children were at a historic low at 22.3%
- Poverty rates for Black adults ages 18-64 was 14.9%, another historic low
- Poverty rates for Black adults 65 and older was unchanged at 17.6%
- The poverty rate for the nation is unchanged at 11.5%
- Though, The Black population was overrepresented in poverty with Black individuals making up 20.1% of population in poverty but only 13.5% of the total population
Learn More: New Population Counts for 62 Detailed Black or African American Groups; National Black (African American) History Month: February 2023; Poverty Rate for the Black Population Fell Below Pre-Pandemic Levels
2020 Census Key Updates: Hispanic Population
Data from the 2020 census showed that the Hispanic/Latino population grew from 50.5 million (16.3% of the U.S. population) in 2010 to 62.1 million (18.7% of the U.S. population) in 2020.
The Hispanic population grew by 23% from 2010 to 2020
- A little more than half (51.1%) of the total U.S. population growth from 2010-2020 came from growth in the Hispanic population.
- Fastest growing Hispanic population: Venezuelan (181.5%)
- Fastest growing Central American group: Honduran population (67.6%).
- Fastest growing Caribbean Hispanic Group: Dominican population (55.2%).
The Nation’s largest Hispanic group remained the Mexican population, but they experienced the smallest growth (12.7%).
- 35.9 million people
- 58% of the nation’s overall Hispanic population
- Down from 63% in 2010
- Mexican population was three times larger than the Caribbean Hispanic population, the largest regional group at 16.2% (includes Cuban, Puerto Rican, Dominican and Other Caribbean Hispanic populations)
- In 40 states, the majority of people who identify as Hispanic are Mexican
- Largest presence in a single county: Los Angeles County (3,416,852 people)
Hispanic groups with over 1 million people:
- Mexican (35.9 million)
- Puerto Rican (5.6 million)
- Salvadoran (2.3 million)
- Cuban (2.2 million)
- Dominican (2.2 million)
- Guatemalan (1.7 million)
- Colombian (1.3 million)
- Surpassed 1 million for the first time
- Honduran (1.1 million)
- Surpassed 1 million for the first time
New York State Statistics:
- Queens County--largest Ecuadorian population (114,064) and the largest Paraguayan population (3,310)
- Bronx County--largest Dominican population (334,347) and the largest Puerto Rican population (237,047)
- Kings County had the largest Panamanian population (13,199)
- Most Hispanics in New York are Puerto Rican (1,000,764)
- New York had the most Dominicans in the Nation (867,304)
Learn More About these population changes amongst the Hispanic Population:Eight Hispanic Groups Each Had a Million or More Population in 2020 (census.gov);Improved Race, Ethnicity Measures Show U.S. is More Multiracial (census.gov)
2020 Census Population Data Takeaways
(As of August 2021)
The U.S. Census Bureau recently released the most detailed data to date, demonstrating that the growth in the American population over the last decade was driven entirely by minority communities. This demographic information will be used to redraw state legislative and congressional voting districts, enforce antidiscrimination laws, and inform research and public and private policymaking for the next decade. The U.S. is diversifying at the fastest rate in the nation’s history, even as overall population growth slows significantly.
U.S. Population Highlights:
- The country’s population grew by 7.4% in the last decade, a slower rate than any decade since the 1930s.
- Non-Hispanic whites make up just under 58% of the American population, the first time since the Census was first conducted that they have fallen under the 60% mark.
- Hispanic or Latino Americans have grown steadily to 62.1 million, or 18.7% of the population, up from 12.6% in 2000 and 16.4% in the 2010 count.
- Asian Americans were the only demographic group to experience more growth from immigration, 3.3 million people, than from natural increase, 1.2 million.
- The number of African Americans increased by an estimated 3.4 million since the 2010 census.
- Adult (age 18 and older) population group grew 10.1% to 258.3 million people over the decade.
- The population underage 18 was 73.1 million in 2020, a decline of 1.4% from the 2010 Census.
- The population of U.S. metropolitan areas grew by 9% from 2010 to 2020, resulting in 86% of the population living in U.S. areas of 50,000 or more in 2020, compared to 85% in 2010.
New York State and City Population Highlights:
- In New York State, with a sizable Latino population, Latino youth make up nearly 25% of the State’s youth population.
- The largest city in the United States in 2020 remains New York with 8.8 million people. This is an increase of 7.7% from 2010.
- The population in every borough grew:
- Brooklyn’s count grew by 9.2% since 2010, to 2,736,074 — the biggest rise of any borough.
- Queens increased 7.8%, to 2,405,464
- Manhattan went up 6.8%, to 1,694,251
- The Bronx jumped 6.3% to 1,472,654
- Staten Island expanded by 5.8%, to 495,747
- Overall in New York City, there was a 4.5% decline in Black residents, or 84,404 people, from the 1,861,295 Black residents counted in 2010. Declines were registered in Manhattan, Brooklyn and Queens and generally stable numbers in The Bronx. Staten Island was the only borough to see an increase by 5.7%.
- The Hispanic population registered a 6.6% growth in New York City, with a 20% increase in Staten Island, 8.8% increase in Queens and The Bronx, and a hike of 4% in Brooklyn.
- There was a 43% increase of Asian New Yorkers in Brooklyn and a 29% jump in Queens.
Review Data Visualizations: Decennial Census P.L. 94-171 Redistricting Data Summary Files, Supplementary Tables on Race and Hispanic Origin: 2020 Census Redistricting, RedistrictingandYou.org- Current Districts and Implications for Post 2020 Maps, and 2020 Population and Housing State Data
Learn More: New Census data to show US diversifying at fastest rate ever, New York City adds 629,000 people, defying predictions of its decline, NYC Planning, What The New Census Data Shows About Race Depends On How You Look At It, and New U.S. census data shows white population shrank for first time
2020 Census Undercount and Overcount Estimates
On March 10, 2022, the U.S. Census Bureau released the Post-Enumeration Survey (PES) and Demographic Analysis (DA) estimates. DA estimates are based on the whole U.S. population on April 1,2020 and PES estimates are based on the household population in the U.S. The results revealed that the 2020 Census overcounted and undercounted various demographic groups. Unfortunately, the Census has a longstanding trend of undercounting Black, Latinx and Native Americans and overcounting populations that identify as white. The findings from the two analyses revealed the following:
Undercount
- The 2020 Census missed Hispanic and Latinos at three times the rate as in 2010 (an undercount rate of roughly 5%, as opposed to 1.5% in 2010).
- The Black or African American population was undercounted at a rate of 3.3%, up from 2.1% in 2010.
- The American Indian or Alaska Native populations, living on reservations, were undercounted at a rate of 5.6%, higher than the 2010 rate of 4.9%.
- The American Indian or Alaska Native population not living on reservations was not miscounted.
- 0–4-year-olds were undercounted twice as much in 2020 compared to 2010 (PES undercounted for. 2.79% and the middle of the DA series for 5.4%).
- 18-29-year old males were undercounted by 2.25% and girls were undercounted by 0.98%.
- As for adults ages 30-49, the PES and DA showed an undercount in males of this age range.
Overcount
- Non-Hispanic White population had a statistically significant overcount rate of 1.64%, lower than the 2010 overcount of 2.62%.
- Asian population had an overcount rate of 2.62% which increased from 0.00% in 2010.
- Native Hawaiian or Other Pacific Islander population had an estimate overcount rate of 1.28%, which is not much different than 2010.
For more information, check out these sources:
https://www.census.gov/newsroom/press-releases/2022/2020-census-estimates-of-undercount-and-overcount.html
https://www.census.gov/newsroom/press-kits/2021/post-enumeration-survey.html
https://www.census.gov/newsroom/press-kits/2020/2020-demographic-analysis.html
https://www.npr.org/2022/03/10/1083732104/2020-census-accuracy-undercount-overcount-data-quality
https://www.bloomberg.com/news/articles/2022-03-10/u-s-census-undercounts-black-latino-and-indigenous-americans-again
Census Interactive Apportionment Map
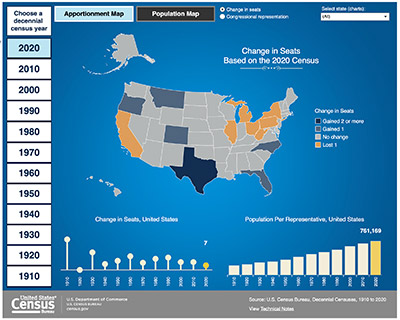 The U.S. Census Bureau launched a new online map to view more than 100 years of population and apportionment data can The “Historical Apportionment Data Map,” can display customized information according to a census year and state.
The interactive map includes:
- Number of seats in the U.S. House of Representatives
- Changes to each state’s number of seats in the U.S. House of Representatives
- Population per representative for each state
- Resident population of each state
- Percentage change in resident population for each state
- Population density of each state
2020 Census Update: New York Will Lose One House Seat
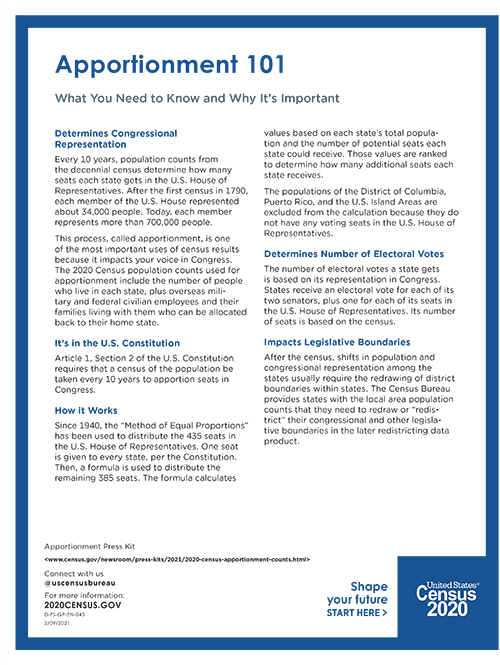
Following the release of the 2020 Census population statistics, Commerce Secretary Raimondo delivered to President Biden the population counts to be used for apportioning the 435 seats in the U.S. House of Representatives, according to a congressionally defined formula in Title 2 of the U.S. Code.
Based on the 2020 Census population counts, 7 House seats will shift among 13 states. One state will gain two seats (Texas), and 5 states will gain one seat (Colorado, Florida, Montana, North Carolina, and Oregon). Seven states will lose one seat (California, Illinois, Michigan, New York, Ohio, Pennsylvania, and West Virginia).
According to the data, New York will lose one seat in the House of Representatives and an Electoral College vote, since the State fell 89 residents short of retaining all of its House seats. New York's House seats will now decrease from 27 to 26, potentially impacting federal funding, presidential elections, and even the decisions made by corporate America. See Press Release
2020 Census Population Statistics
The U.S. Census Bureau announced the results of the 2020 Census, showing that the resident population count for the United States on April 1, 2020, was 331,449,281. The U.S. population grew more than 7 percent since the 2010 census, the smallest increase since the 1930s. Findings include:
- The state with the smallest population was Wyoming with 576,851.
- The state with the largest 2020 census resident population was California with 39,538,223.
- With 4.3 percent growth, New York is the fourth largest state at 20,201,249 residents—behind, California, Texas and Florida, which has now surpassed New York.
- The state that gained the most numerically since the 2010 Census was Texas (up 3,999,944 to 29,145,505).
- The fastest-growing state since the 2010 Census was Utah (up 18.4% to 3,271,616).
- Puerto Rico's resident population was 3,285,874, down 11.8% from 3,725,789 in the 2010 Census.
- The south grew the fastest over the last decade with a 10.2% increase in population.
U.S. Census America Counts:
The Census Bureau also released information about the quality of the 2020 Census from two methods: (1) analyses that compare the first census results to other ways of measuring the population in three other population benchmarks — previous decennial census results, estimates from the Census Bureau’s Population Estimates Program, and the 2020 Demographic Analysis estimates, and (2) assessments of metrics that provide insight into the Census operations, including the percentage of addresses in the 2020 Census that the bureau determined were occupied, vacant or nonexistent, and the nonresponse follow-up operation, collectively and comparing them to past surveys.
Press Release Data Quality Metrics
Preliminary Analysis of National and State-Level Results from Census 2020
April 2021 Update: Citizenship and the 2020 Census
In keeping with the President Biden’s Executive Order signed in January 2021, the U.S. Census Bureau will not include information about citizenship or immigration status in the data produced for apportionment. Data on the citizen voting age population will be produced from the American Community Survey.
2020 Census Data Delay: How It Impacts States and Redistricting
On January 27, 2021 the U.S. Census Bureau announced the apportionment data used for determining Congressional seats, is expected to be delivered by April 30, 2021. At this moment, the Bureau has not determined when redistricting data, which is used for redrawing congressional and legislative districts, will be released. The data is not expected before July 30, 2021. See Press Release and Read Statement from Census Bureau Director
According to the federally-mandated deadlines, data used for reapportioning districts is expected to be delivered by December 31, 2020 while the data for redistricting legislative and congressional seats is due no later than April 1, 2021. For all states, the delay compresses the timeline for redistricting while making it harder for some states to meet the redistricting deadlines indicated in their constitutions and statues. Read Article
Biden Administration Responds to Undocumented Immigrants' Exclusion from Census Count
On January 20, 2021, after being sworn in as the 46th President of the United States, President Joe Biden signed an executive order, reversing a Trump Administration memorandum seeking to exclude undocumented immigrants from the 2020 Census count for apportionment of representation. Read Article
U.S. Census Bureau Immigration Count Update
After receiving a memorandum from the Office of Inspector General, Department of Commerce on January12, 2021, the U.S. Census Bureau stopped all work on the Trump Administration’s request to produce a state-by-state count of unauthorized immigrants which would have adjusted the population figures used to reallocate funding and the number of congressional seats to each state. Census Bureau Director Steven Dillingham, sent a memo instructing internal teams assigned to the task to cease their work, ending the bureau’s participating in the Administration’s attempts to exclude undocumented immigrants from the 2020 Census count. See Press Release and Read the Article
Previously, the Administration’s memo, which was issued in July, was found to be unlawful and unconstitutional by three lower courts in 2020. In December 2020, the Supreme Court ruled that it was “premature” for any court to weigh in because the case is "riddled with contingencies and speculation."
This decision from the U.S. Census Bureau comes after Deputy Assistant Attorney General John Coghlan, told a federal judge that the state population counts needed for reapportioning House seats and electoral votes will be delayed due to irregularities in the count. Read Article
An official order by the U.S. District Court for the Northern District of California in the National Urban League case was issued, requiring the Bureau enter a stipulation for a 21-day stay in the case, ensuring the privacy and integrity of Census data. See Press Release and Read Order
Following the January 12 order to halt the exclusion of undocumented immigrants in the 2020 Census count, Census Bureau Director Steven Dillingham announced his resignation and retirement from the Bureau on January 18, 2021. His departure is effective January 20, 2021. See Press Release
Supreme Court Weighs In On Immigrants and the Census
On Monday, November 30, 2020, the Supreme Court heard oral arguments regarding whether or not the Trump Administration has the authority to exclude undocumented immigrants from the 2020 Census apportionment. In July, the administration issued a memorandum, seeking to bar undocumented immigrants from being counted in the Census. In response, New York Attorney General Letitia James, along with Attorneys General from 20 states and 15 cities, filed a lawsuit calling the Trump Administration’s attempt unlawful and a violation of the Constitution. See Press Release
Prior to arriving at the Supreme Court, the case was presented to a lower federal court in New York who rejected the administration’s attempt, ruling that undocumented immigrants must be counted in the Census. See Press Release. Subsequently other federal district courts in Maryland and California issued similar rulings.
The Supreme Court decided on December 18, 2020 to dismiss the challenge made by the coalition of states led by NY AG Letitia James. The court stated that the challengers did not have the legal injury to bring the case before the Supreme Court because the government has yet to announce which individuals they seek to exclude from the Census count. Read Article
In response to the decision by the Supreme Court, NY AG Letitia James vowed to continue fighting to protect the Census count and to ensure everyone, including undocumented immigrants, is counted. See Press Release
What’s At Stake:
If the Supreme Court rules to exclude undocumented immigrants from the Census various states, including New York, could lose congressional seats, presidential electors for the Electoral College and federal funding, impacting our Black and Latinx communities.
New York Census Outcomes
(Self-response rates don’t include Nonresponse Follow-up (NRFU) efforts, which include Census enumerators who canvassed neighborhoods).
New York State realized a self-response rate of 64.2% (New York City achieved a historic self-response rate of 61.8% in the 2020 Census, a figure that outperforming several major cities in the United States, including Los Angeles, Chicago, Boston, Philadelphia, Miami, Dallas, Baltimore, and Houston.
Read more: https://www.gothamgazette.com/city/9844-new-york-city-overcomes-obstacles-outperform-2020-census-rate
County Self-response Rates
Richmond (Staten Island): 66.4%
Manhattan: 63%
The Bronx: 62.7%
Queens: 62.7%
Kings (Brooklyn): 59%
SHAPE YOUR FUTURE
JOHN JAY COUNTS! YOU COUNT!
What is the Census and Why is it Important?
The U.S. Census takes place every 10 years to take a snapshot of America. The Census is mandated by our Constitution (Article 1, Section 2), and administered by the U.S. Census Bureau, a nonpartisan government agency. The goal of the decennial census, is to count every person who lives in the United States. This means that the Census counts people of all ages, races, birth origin, immigration status living in the United States, including people living in the five U.S. territories (Puerto Rico, American Samoa, the Commonwealth of the Northern Mariana Islands, Guam, and the U.S. Virgin Islands).
Why Should I Participate?
Historically, New York City has experienced significant undercounts of its population, particularly in communities of color. This means New York City has historically been undercounted and didn’t get its fair share of funding and representation. Let’s make sure you count!
How Can I Participate?
Census day is April 1, 2020. Between March 2020 through April 1, 2020, every home will receive an invitation to participate in the Census. Regardless of how you respond, the questions are the same and the confidentiality of the information is protected under the law. By you responding and taking the initiative, your voice counts! You can respond online, by phone or by paper. The Census will be conducted between mid-March and the end of July.
Opportunities
Check out the Census Bureau for paid job opportunities so you can work within your community to encourage a complete and full count. Apply online at 2020census.gov/jobs The hourly rate for census takers in New York City is $28.00 an hour. Most job offers will be made between January and April 2020. Paid training will be conducted between March and mid-May. From May through July, census takers will help collect responses from households that have not yet responded to the census.
Census Interactive Response Rate Maps
- U.S. Census Response Rate Tracking
- New York local self-response maps from the Center for Urban Research at the CUNY Graduate Center
#JOHNJAYCOUNTS